

Understanding the Impact of Climate Variables on Comfort in Architectural Tropical Spaces
- Dennis Asis

- Jan 27
- 5 min read
Updated: Jan 29


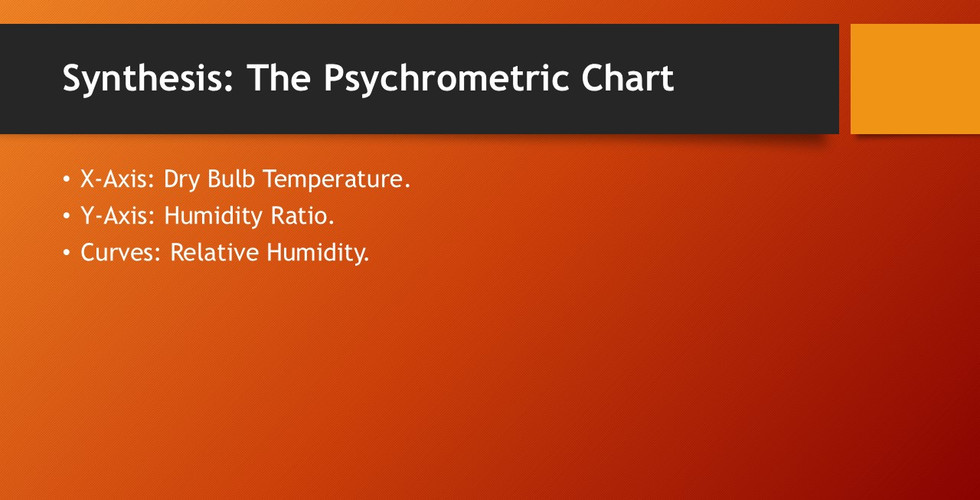


Creating comfortable indoor environments depends heavily on how climate variables interact with architectural design. Comfort is not just about temperature; it involves a complex balance of environmental factors that influence how occupants feel within a space. Understanding these factors and applying thermal comfort indices can guide architects and designers to create spaces that support well-being and productivity.
How Climate Variables Affect Comfort on Architectural Tropical Spaces
Several climatic elements shape the indoor environment and influence comfort levels:
Air Temperature
The most obvious factor, air temperature directly affects how warm or cool a space feels. However, temperature alone does not determine comfort.
Humidity
High humidity can make a space feel hotter, while low humidity can cause dryness and discomfort. Balancing moisture levels is key to maintaining comfort.
Air Movement
Gentle air circulation can enhance comfort by promoting heat loss through evaporation and convection. Stagnant air often leads to stuffiness.
Radiant Temperature
Surfaces like walls, floors, and ceilings emit heat that can raise or lower the perceived temperature. For example, cold walls can make a room feel cooler than the air temperature suggests.

These factors interact in complex ways. For example, a room with moderate temperature but high humidity and poor ventilation may feel uncomfortable. Designers must consider all these elements to create balanced environments.
Thermal Comfort Indices and Their Use
Thermal comfort indices provide measurable ways to assess how comfortable a space will feel based on climate variables. Some widely used indices include:
Predicted Mean Vote (PMV)
This index predicts the average thermal sensation of a group of people on a scale from cold to hot. It considers temperature, humidity, air velocity, and clothing insulation.
Operative Temperature
This combines air temperature and radiant temperature to give a better sense of the actual thermal environment experienced by occupants.
Adaptive Comfort Model
This model accounts for occupants’ ability to adapt to their environment, such as opening windows or changing clothing, making it useful for naturally ventilated buildings.

Applying these indices for Architectural Tropical Spaces helps architects evaluate whether a design will meet comfort needs before construction. For example, using PMV calculations can guide decisions on insulation, window placement, or HVAC system design.
Practical Examples in Design
Consider a residential building in a hot, humid climate. Designers might use shading devices to reduce radiant heat from the sun and incorporate cross-ventilation to increase air movement. By calculating the PMV, they can ensure the indoor environment stays within a comfortable range without relying heavily on air conditioning.
In cooler climates, designers might focus on maximizing solar gain through south-facing windows and using materials with high thermal mass to store heat. The operative temperature index helps balance air and surface temperatures to maintain comfort during cold seasons.

Solar Absorptance levels of common building materials.
The following list details the Solar Absorptance levels of common building materials. Note on "Heat Absorptance": In building physics, this is technically referred to as Solar Absorptance. It represents the percentage of solar radiation (heat and light) that a material soaks up.[2]
1. Roofing Materials
Roofing materials vary significantly by color and age.[1] Darker roofs absorb much more heat than lighter "cool" roofs.[1][4]
Material | Notes | |
Asphalt Shingles (Black/Dark) | 90% – 97% | |
Asphalt Shingles (White/Light) | 70% – 80% | Standard white granules are not purely reflective.[1] |
Slate (Dark Grey) | 85% – 90% | Natural stone roofing.[1] |
Concrete Tiles (Unpainted/Grey) | 65% | Absorptance increases as the tile dirties/ages.[1] |
Red Clay / Terracotta Tiles | 55% – 65% | Traditional "Spanish style" roofing.[1] |
Metal: Galvanized Steel (New) | 60% – 65% | Shiny, but oxidation (dulling) increases absorption over time.[1] |
Metal: Painted White | 20% – 30% | |
Metal: Painted Dark Green/Red | 80% – 88% | Commonly used in residential metal roofing.[1] |
Bitumen / Tar & Gravel | 90% – 95% | Common on flat commercial roofs.[1] |
Membrane (Black EPDM) | 90% – 94% | Rubber roofing; gets very hot.[1] |
Membrane (White TPO/PVC) | 15% – 25% | Highly reflective; keeps buildings cooler.[1] |
2. Wall & Masonry Materials
Texture plays a role here; rougher surfaces (like brick) tend to trap light and absorb more heat than smooth surfaces.[1]
Material | Notes | |
Brick (Red, Common) | 55% – 70% | Varies by clay source and firing temperature. |
Brick (White/Yellow/Buff) | 25% – 45% | Lighter clay bricks absorb significantly less heat.[1] |
Brick (Dark Blue/Brown) | 80% – 85% | Staffordshire blue or dark engineering bricks.[1] |
Concrete (Typical Grey) | 60% – 65% | Fresh concrete is lighter (~60%); old/dirty concrete is darker.[1] |
Limestone | 30% – 45% | Light natural stone; stays relatively cool.[1] |
Granite (Redish) | 50% – 55% | |
Marble (White) | 40% – 45% | |
Sandstone (Light) | 45% – 55% | |
Wood (Smooth, Light - e.g., Pine) | 40% – 50% | Unpainted/unstained. |
Wood (Dark - e.g., Walnut/Mahogany) | 70% – 75% | Darker woods or stained timber absorb more.[1] |
3. Paving & Infrastructure
Material | Notes | |
Asphalt (New Paving) | 90% – 95% | Fresh blacktop is extremely hot.[1] |
Asphalt (Aged/Grey) | 80% – 85% | Lightens as aggregate becomes exposed.[1] |
Concrete Pavement | 60% – 70% | Significantly cooler than asphalt.[1] |
Grass / Vegetation | 70% – 80% | Note: While plants absorb sunlight, they do not heat up like stone because they use the energy for photosynthesis and cool themselves via evapotranspiration. |
4. Metals (Unpainted)
Metals are unique because they often have low absorptance (they reflect light) but also low emissivity (they hold onto the heat they do absorb).[1]
Material | Notes | |
Aluminum (Polished) | 5% – 15% | Acts almost like a mirror.[1] |
Aluminum (Oxidized/Anodized) | 15% – 40% | Dull finish absorbs more.[1] |
Copper (Polished) | 15% – 20% | |
Copper (Tarnished/Patina) | 60% – 80% | Dark brown/green oxidation increases absorption heavily.[1] |
Stainless Steel | 30% – 40% | Varies by polish/grade.[1] |
5. Paints & Coatings
If you paint a material, its absorptance changes to match the paint.
Credible Sources
The values above are derived from standard engineering data used in HVAC load calculations and building energy modeling.
ASHRAE (American Society of Heating, Refrigerating and Air-Conditioning Engineers):
Source: ASHRAE Handbook – Fundamentals (Chapter: Climatic Design Information). This is the primary industry standard for these values.
CIBSE (Chartered Institution of Building Services Engineers):
LBNL (Lawrence Berkeley National Laboratory):
Source: Cool Roofing Materials Database. LBNL conducts extensive testing on solar reflectance of roofing materials to combat urban heat islands.[1]
NASA:
Source: NASA Reference Publication 1121, which lists absorptivity and emissivity for thermal control of spacecraft and habitats.
Head over to our Resource Section for more insights and useful references.


Comments